All Kernun UTM proxies write information about their state and progress into the log. The log can be
used later to analyze the traffic, generate statistics, find out why a certain connection was refused,
or look for system errors. Logging is switched on for all proxies by default. To
alter the log settings of a proxy, add a log section with desired items (see below) into it.
Logging can be done either by the standard syslog daemon (the default is the
LOCAL4 facility, which logs into the /var/log/kernun-debug file), or directly
into a specified file. Moreover, there is a possibility to log a small amount of the last data for each proxy into a
memory-mapped file, which can be used for system failure analysis. The facility item is used to
change the facility number, the file item to enable logging into a file and the mem-file
item to specify the memory-mapped file.
There are 9 levels of log messages (the lower the number, the higher the severity) and the administrator can choose
the level of logging. The log level of a proxy can be set either in the configuration using the
level item, or at runtime by sending a SIGUSR1/SIGUSR2 signal to
the proxy process to increase/decrease the level. The proxy logs only messages with a level lower or equal to its log level.
The log message level is appended to the MsgID column of the message, so you can easily filter only
messages of a certain log level in the log browser (Section 1.3, “Logs”).
Each log message contains the MsgID column, which stands for the type of the message. For every log message
type, there is a manual page in the section 6. The Message ID consists of a component code (an application name, possibly with
a suffix), message number and message log level.
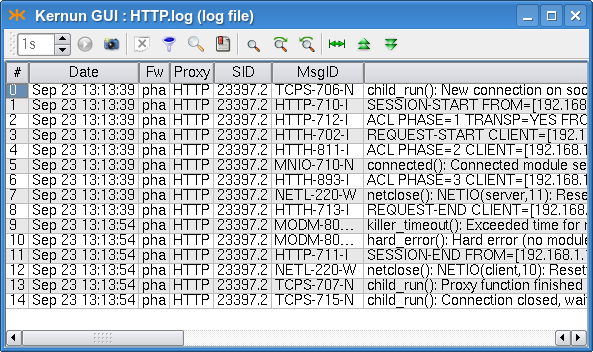
Most of the information on normal traffic can be gathered from the level I (information statistical
messages) and level N (noticeable conditions), which are both logged with any log level set.
For example, a simple HTTP 1.1 request is started by TCPS-706-N which informs about a new TCP connection
and assigns the connection to a child, then a session is started (HTTP-710-I) and proceeds with the first
phase of acl. If the session is accepted, then the HTTP request is started (HTTH-702-I), request-acl is
evaluated (HTTH-811-I) and the client is connected to the server (MNIO-710-N). When
the answer, the document, arrives from the server, doc-acl is evaluated and the message HTTH-893-I is
added to the log. If the document was accepted, the request end message HTTH-713-I is added and the proxy
waits for other requests on the same socket (we are communicating over the multi-request HTTP 1.1 protocol). Then, possibly, more
requests are served and, eventually, the session is ended (HTTP-711-I), the proxy finishes the connection and
waits for a new one (messages TCPS-707-N and TCPS-715-N). The log of the described
situation is shown in Figure 5.25, “Log of an HTTP request”.
For more information on logging, see logging(7). For details concerning configuration of logging, see the log(5) manual page.
The created log files grow enormously and might fill all the free disk space. Another problem of logging is that
manipulation with big files is more difficult (and slower) than with smaller ones. Kernun UTM provides tools for
log rotation as a method of solving the above-mentioned problems. Log files are regularly (daily, weekly or monthly)
renamed and the system starts afresh with an empty log file. The old log files are thrown away after a certain period.
The administrator can configure log rotation by adding an rotate item into the system-level
rotate-log section for the entire Kernun UTM or into the log section of a particular proxy,
if it logs into a separate file. In the rotate item you can specify the owner, group and rights of the
file, the number of coexisting history logs, the compression method and the time of log creation. The logs can be
rotated either periodically (daily, weekly or monthly), or when the size of the log exceeds a specified limit.
The log rotation will only work if you have it scheduled in the crontab, as illustrated e.g. in
the sample crontab file /usr/local/kernun/conf/samples/include/crontab.cml.
Each of the connection-oriented proxies (http-, ftp-, imap4-, pop3-,
smtp-, sip-, sqlnet- and tcp-proxy) and udp-proxy are able to write
information about the current sessions (connections they are currently serving) into special binary files that can be
used to monitor their current state. A log does not provide all the necessary information when huge files are being downloaded:
we are informed that the request has started, but do not know anything until it ends. This is the right time to use the
monitor(1)
application, which collects information about the current session's progress and is able to present it to the user
(either as plain text, or in the HTML format). Monitoring is best accessible from the GKAT window of the Kernun GUI via
the Monitor tab in the detail of a proxy (or the Proxies root node). The information
in the monitor include the name and type of the proxy, the PID of the proxy process, the duration of the current session,
the server and client IP addresses and names, the number of bytes transferred and delivered in both directions, the connection
speeds, and the URI of the document (in the case of http- or ftp-proxy). Monitoring is only available for proxies that contain
the monitor section in their configuration.
Monitoring information is also stored in a database that is used for graph generation; for more details see Section 6.5, “Monitoring of System Parameters”.
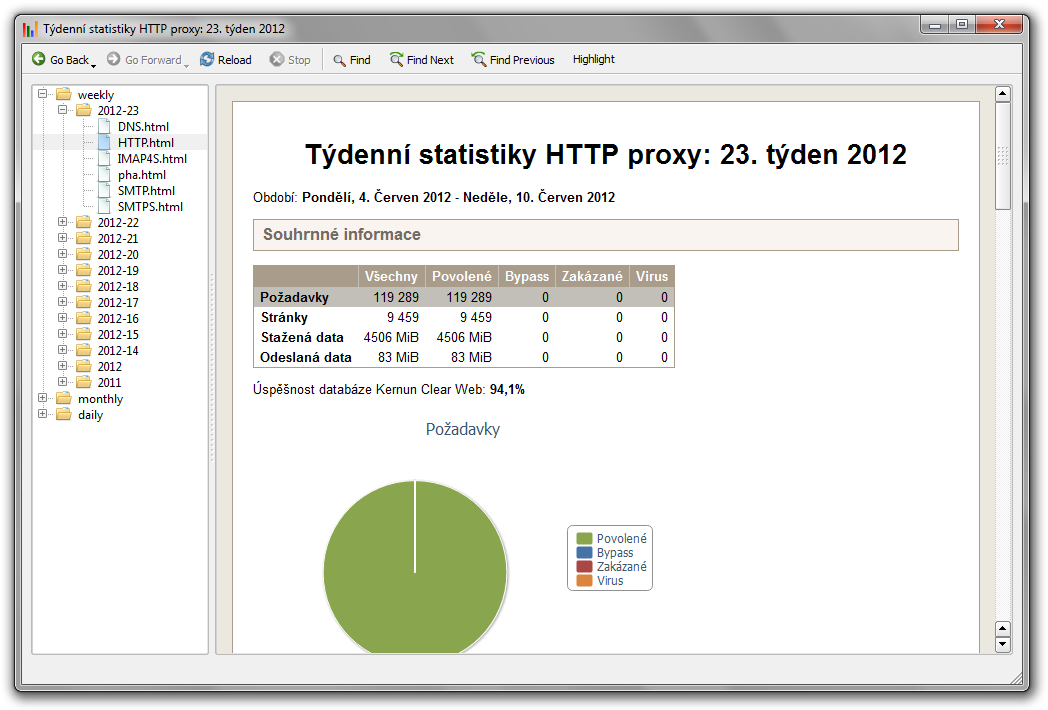
Every proxy can generate statistics of its usage; these statistics are then shown in the statistics browser window (Figure 5.26, “Statistics browser window”), which is accessible via the menu in the GKAT. In the browser, the tree on the left-hand side shows the available statistics (for each of the available periods and all the proxies that generated statistics in that period). The right-hand part of the window shows the statistics of the selected period, date and proxy as an HTML page.
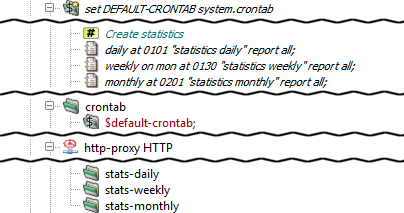
To enable the generation of statistics for the desired proxies or the whole system,
insert stats-daily, stats-weekly and/or stats-monthly
sections into their configurations. Inside these sections, you can specify the number of top results
for each watchable parameter (if not set, the default value will be used). By default, the generation
scripts for each of the periods are scheduled in the crontab. Therefore, no changes should be necessary.
Figure 5.27, “Configuration of statistics” shows a sample statistics configuration for an http-proxy.
Sample configuration with generation of statistics for most of the proxies and the whole system
is included in /usr/local/kernun/conf/samples/cml/statistics.cml.
Kernun UTM is able to monitor various system parameters, from hardware temperature to
proxy loads, and store their values in a database. Later it is possible to create
and view graphs generated from these values and thus examine the traffic load history.
The graphs are generated by the command line tool rrd, described in the
rrd(1)
manual page, which can be also used to view the available graph types and intervals. The easiest way to
access the graphs is using the Graphs tab in the GKAT window of the Kernun GUI. It is available
for all the proxies and network interfaces, and for several system components. All the system parameters are
displayed in the Graphs tab of the top-level GKAT node, as depicted in Figure 3.8, “Graphs page”.
While system components other than proxies generate their graphs automatically, you have to insert
a monitoring section into the configuration of a proxy to generate its graphs.
Chosen graphs can be added to the Favorite graphs tab in the Graphs tab of
the top-level GKAT node to make them more accessible; the period of the displayed graphs can be changed using a combo box.